Introduction
In this first tutorial, we will create our first 3D wireframe. We will:
- Define Node and Edge objects
- Define a Wireframe object consisting of Nodes and Edges
- Define a Wireframe cube
The full code for this tutorial is can be found by following the Github link at the top of the page
Objects
In order to display and manipulate objects on the screen, we have to describe them mathematically. One way to represent a simple shape is with a list of nodes, edges and faces.
- Nodes: points with three coordinates, x, y and z.
- Edges (sometimes called vertices): lines connecting two nodes.
- Faces: surfaces bounded by multiple edges.
To start with we'll work with wireframe objects, which are only made up of nodes and edges. That way we won't have to worry about shading and figuring out which parts of the object are in front of which others until later.
So let's start by creating some objects (in a file called wireframe.py) with the appropriate properties:
class Node:
    def __init__(self, coordinates):
        self.x = coordinates[0]
        self.y = coordinates[1]
        self.z = coordinates[2]

class Edge:
    def __init__(self, start, stop):
        self.start = start
        self.stop  = stop

class Wireframe:
    def __init__(self):
        self.nodes = []
        self.edges = []
We should also give the Wireframe class a couple of methods to make it easy to define the nodes and edges of a Wireframe object:
def addNodes(self, nodeList):
    for node in nodeList:
        self.nodes.append(Node(node))

def addEdges(self, edgeList):
    for (start, stop) in edgeList:
        self.edges.append(Edge(self.nodes[start], self.nodes[stop]))
Both these methods take lists, which I think is the most versatile approach. The addNodes function takes a list of coordinates. The addEdges function takes a list of pairs of node indices to join. For example, we can add three nodes and create an edge between the second two like so:
my_wireframe = Wireframe()
my_wireframe.addNodes([(0,0,0), (1,2,3), (3,2,1)])
my_wireframe.addEdges([(1,2)])
Now would be a good time to add a couple of output functions to the Wireframe class to make debugging easier later on
def outputNodes(self):
    print "\n --- Nodes --- "
    for i, node in enumerate(self.nodes):
        print " %d: (%.2f, %.2f, %.2f)" % (i, node.x, node.y, node.z)

def outputEdges(self):
    print "\n --- Edges --- "
    for i, edge in enumerate(self.edges):
        print " %d: (%.2f, %.2f, %.2f)" % (i, edge.start.x, edge.start.y, edge.start.z),
        print "to (%.2f, %.2f, %.2f)" % (edge.stop.x,  edge.stop.y,  edge.stop.z)
The Cube
I think the simplest shape to start working with is a cube. Although a tetrahedron has fewer sides, its sides aren't orthogonal, which makes things a bit trickier.
The nodes of a unit cube can be easily defined with a list comprehension:
if __name__ == "__main__":
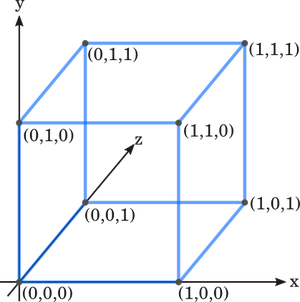
cube_nodes = [(x,y,z) for x in (0,1) for y in (0,1) for z in (0,1)]If you're not familiar with list comprehensions, then now might be a good time to learn how they work, because I think they're one of the best things in Python and so use them whenever I can. The above list comprehension creates a list of every possible 3-tuple of the digits 0 and 1, thus defining the points of a unit cube.
In this diagram, I represent the z-axis increasing as you move into the screen, but you could equally have it decreasing as you move into the screen. Similarly, the y-axis increases as you move up the screen, which standard for Cartesian axes, but not how computer graphics are generally displayed. I'll discuss this more in the next tutorial, but for now it's not really important.
We can now create the nodes of our cube:
cube = Wireframe()
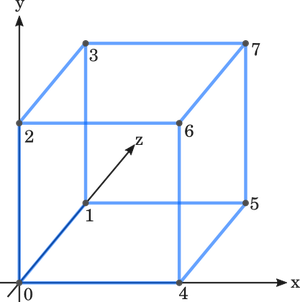
cube.addNodes(cube_nodes)The edges are a little trickier to define. I find it easiest to connect them in groups that are parallel. For example, in this diagram, you can see that the edges parallel to the x-axis connect the node pairs (0,4), (1,5), (2,6) and (3,7).
We can define the edges parallel to the x-axis with another list comprehension:
cube.addEdges([(n,n+4) for n in range(0,4)])The remaining edges can be added like so:
cube.addEdges([(n,n+1) for n in range(0,8,2)])
cube.addEdges([(n,n+2) for n in (0,1,4,5)])
Verify the cube has the properties you expect with:
cube.outputNodes()
cube.outputEdges()
Now we have a cube object, but it only exists as an abstract object. In the next tutorial, we'll display it.
Comments (8)
Guillaume on 9 Dec 2011, 10:31 a.m.
Excellent tutorial! I hope you make more like this one, or go into more detail like lighting.
Bayside on 4 Mar 2012, 4:43 p.m.
I just wanted to tell you this was the best intro tutorial on pygames 3D elements I've come across. I've been reading totorials for multiple toolkits on pyOpenGL for easily a month, and they all seem to skip the fundimentals and assume you're coming with a background programing in C or C++. Others simply said this stuff is found in the OpenGL Class discriptions, or handed you a completed mesh to bypass one of the most important fundimentals of OpenGL, vertex nodes and edges. Thank you for starting out with the real basics. This tutorial was clear, well documented and diagramed. I look forward to reading the rest of your tutorials.
Peter on 4 Mar 2012, 10:08 p.m.
Thanks, the tutorials start off simply as me trying to work out how 3D graphics can be achieved on a 2D screen, starting from first principles. I keep meaning to look at all the OpenGL stuff, but it looks very complex.
Ron on 27 Jul 2012, 7:15 p.m.
Absolutely amazing tutorial, I was looking for a good pygame 3D tutorial for so long now, and accidently came across it. It is definitely one of the best tutorial I have ever seen, and thank you so much for it!
idk on 6 Jul 2013, 5:18 a.m.
Thanks for this tutorial! This one actually makes sense, and we get to create our own module to create 3D graphics! :D
Mohamed Atia on 6 Jan 2015, 8:49 p.m.
Hi Peter,
You have noted "Pygame is not really designed for 3D graphics".
Can you advise what modules / libraries are really designed for 3D graphics?
joseph on 8 Mar 2016, 7:39 p.m.
Hi collin,
I was wondering if you knew how I could make a 3d sphere like in your example video at the beginning. That would be very helpful !
Thanks a lot,
SourCream27 on 29 Mar 2019, 6:49 p.m.
Amazing tutorial, thank you!